O.T.Mining address
OT Corporate Assets   Corporate Assets
line
Porphyry-Reports August 11, 2009 - Comprehensive Report on the Ruby Property's Porphyry Copper/Molybdenum Exploration Potential
October 28 , 2008 - Report on a New Porphyry Copper-Molybdenum Target on the Ruby Property
 

NORTH ANOMALY - HIGHLIGHTS

  • Extensive 15,000 by 8,000 foot target area defined by ground geophysical surveys (I.P.), Mobile Metal Ions soil geochemistry and diamond drilling
  • Target area hosts a drill-proven porphyry copper-molybdenum deposit with a vertical extent of approximately 2,600 feet
  • Porphyry copper-molybdenum deposit is hosted by potassic- and phyllic-altered Boulder Batholith (host rocks and alteration characteristic of the Richest Hill On Earth at Butte)
  • Recently completed I.P. survey indicates the mineralization is characterized by multiple targets (n=84) indicating extensive zones of sulphide mineralization
  • Numerous base and precious metal soil geochemical anomalies delineated including a 1,150' by 575' (350 m by 175 m) gold-silver MMI anomaly
  • Potential for veins and bulk mineable copper, molybdenum, gold and silver
s

North Anomaly

Click to enlarge
s

North Anomaly

Click to enlarge

s

North Anomaly

Click to enlarge

Looking southeast along the east side of North Anomaly Ridge.


View looking south at NA04-6 Hill. Arrow points to the approximate location of core hole NA04-6. The hole is sited approximately 100’ over the ridge line shown here.


Gold-Silver Mine Compilation North Anomaly

Exploration 2006 and Beyond
line

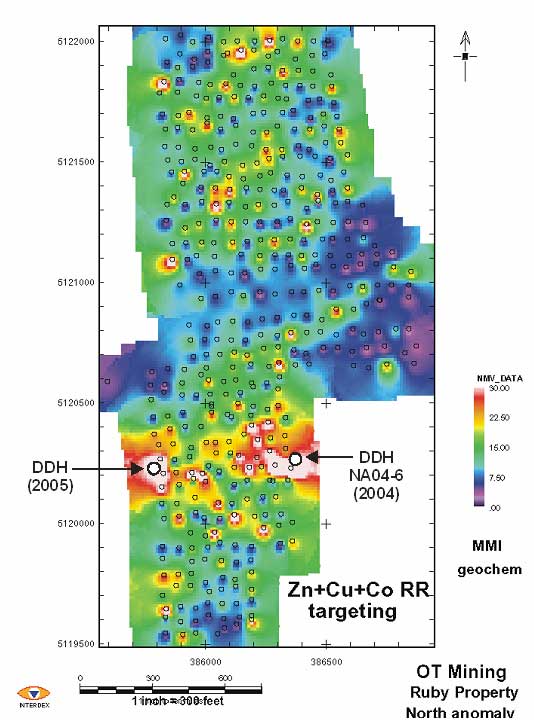
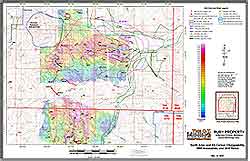
In 2002 O.T. Mining undertook a soil geochemical survey comprising 462 soil samples that were collected based on sampling and analytical protocols established during previous orientation surveys on the property. The results indicated a 400 square foot copper, cobalt and zinc anomaly was present in the area.

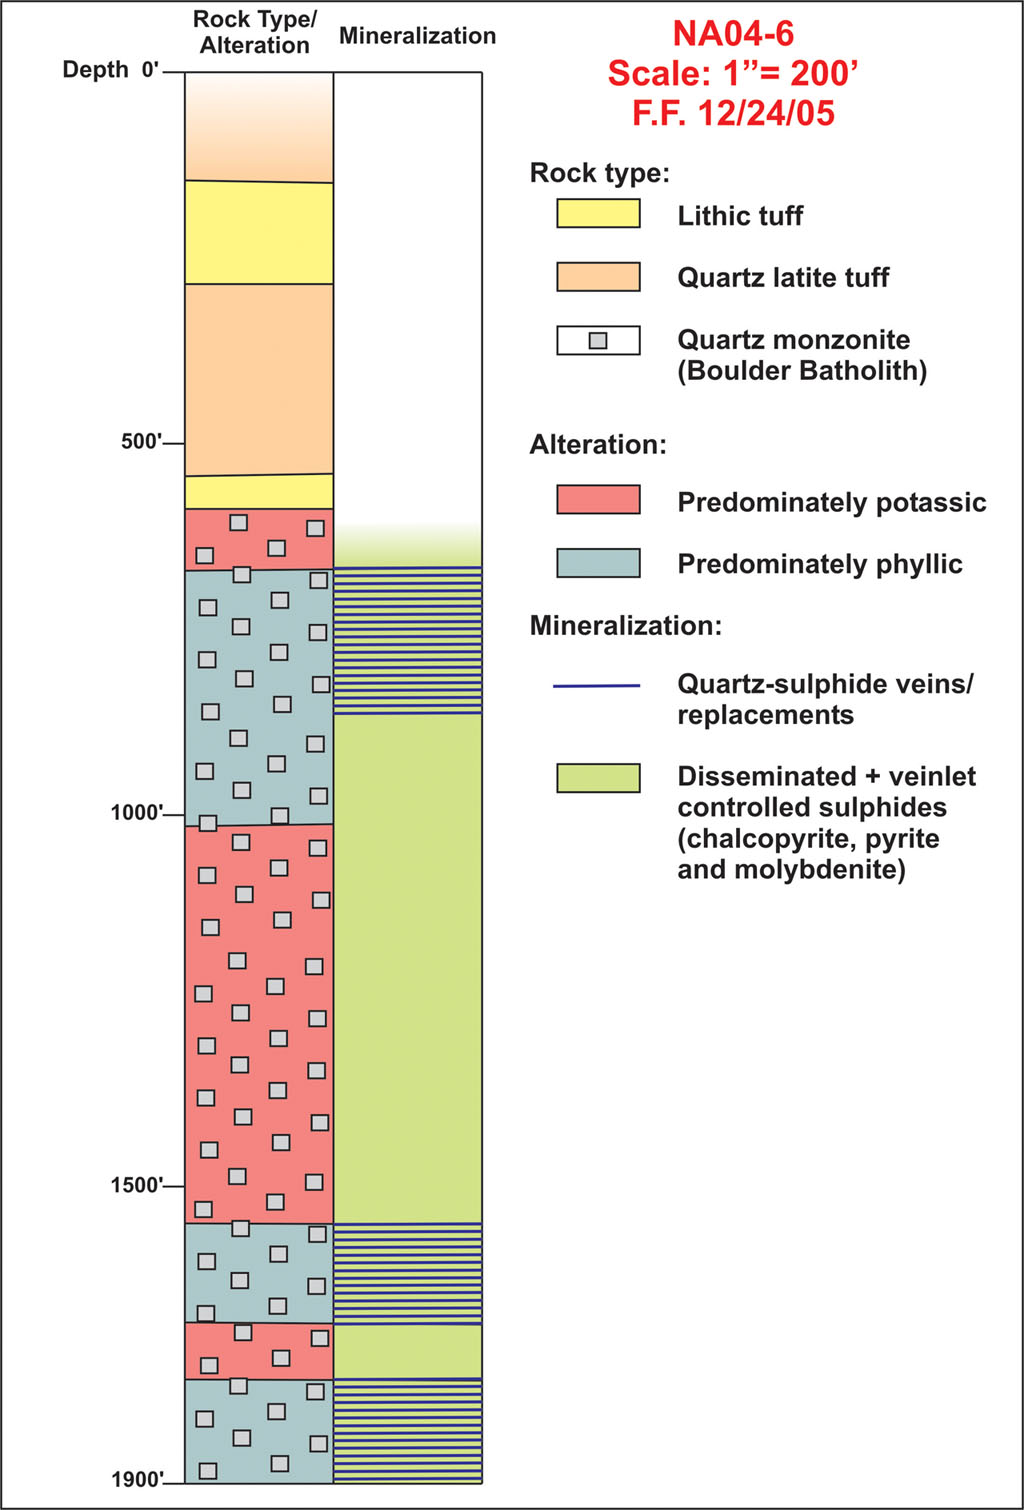
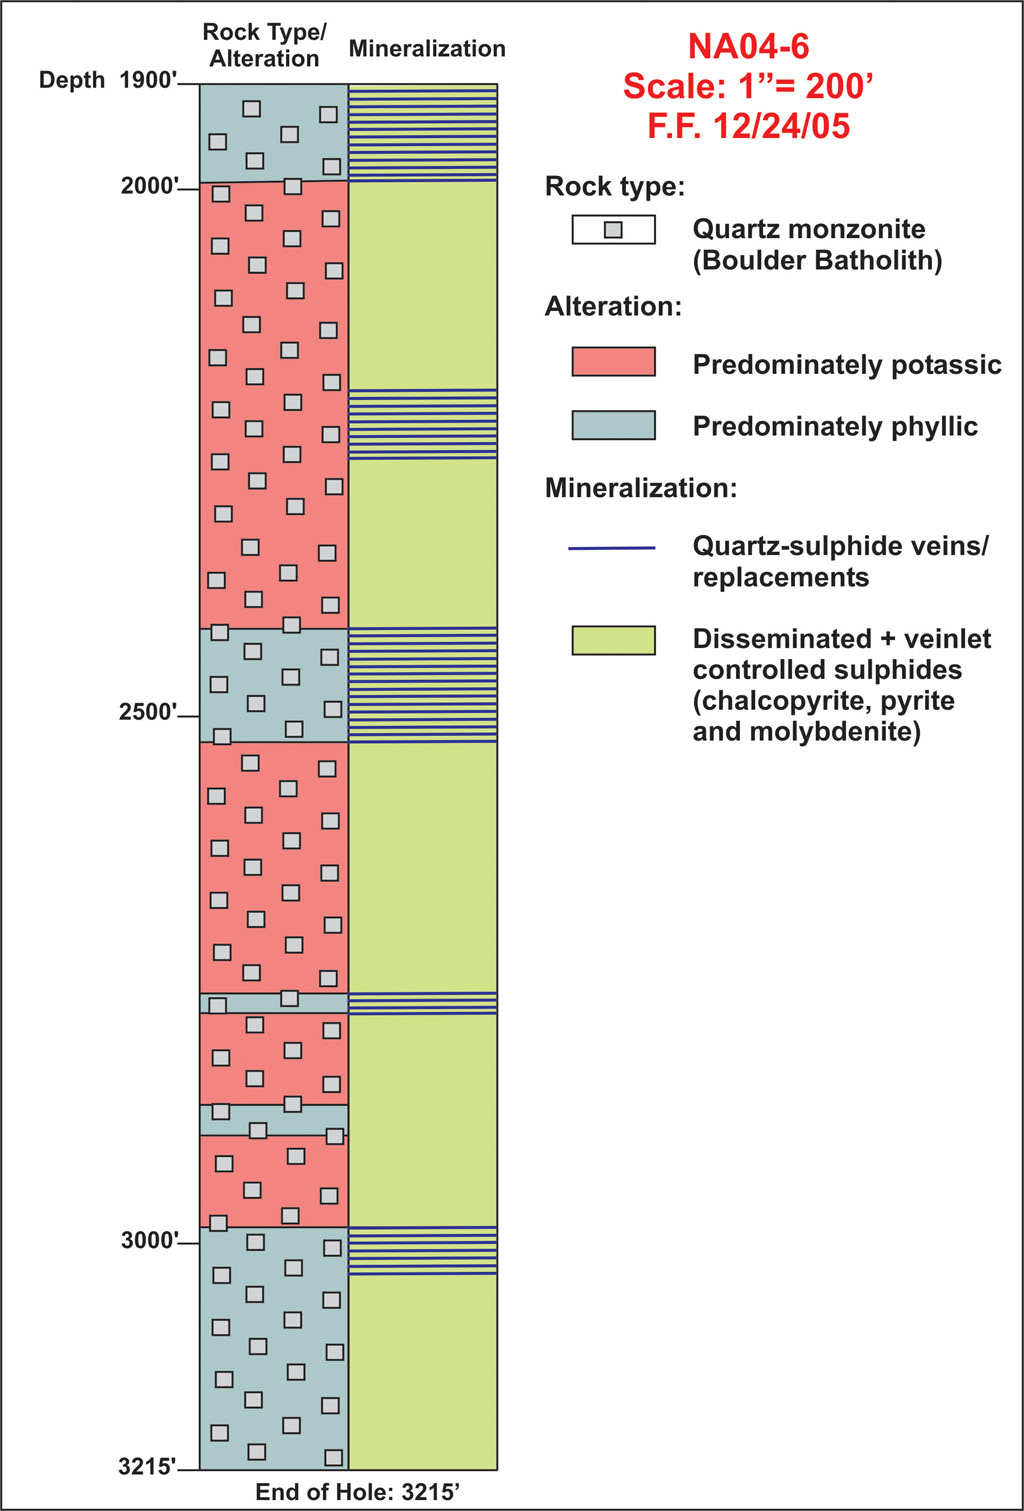
This anomaly was tested with vertical hole NA04-6 and intersected approximately 2,600 feet of continuous disseminated and veinlet chalcopyrite with molybdenite and pyrite beneath 587 feet of barren felsic pyroclastic volcanic rocks. Host rocks to this mineralized zone were potassic- and phyllic-altered quartz monzonite of the Boulder Batholith.

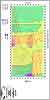
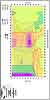
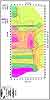
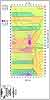
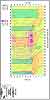
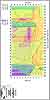
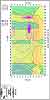
The location of the discovery drill hole in relation to the MMI anomaly is depicted in Figure 1 and a stratigraphic column depicting lithology, alteration and mineralization in drill hole NA04-6 is given in Figures 2 and 3.

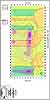
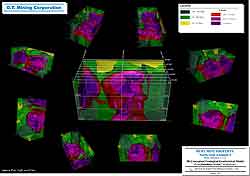
Subsequently, O.T. Mining enlarged the Ruby property to 21.3 square miles encapsulating all prospective ground including a large I.P. anomaly defined by the Anaconda Company in 1966 (Figure 4). Titan 24 deep-looking I.P. was undertaken on the North Anomaly to ascertain the possible dimensions of the mineralized Batholith and a distinctive picture of the extensively mineralized Boulder Batholith was obtained. In cross-section the mineralized Boulder Batholith is immediately apparent (Figure 5) and the accompanying alteration of the Batholith by the mineralizing process is depicted as low resistivity in Figure 6.

Click to enlarge

Fig 1
Click to enlarge

Click to enlarge

Fig 2
Click to enlarge

Click to enlarge

Fig 3
Click to enlarge

s
Click to enlarge
s

Fig 4
Click to enlarge

s
Click to enlarge
s

Fig 5
Click to enlarge

s
Click to enlarge
s

Fig 6
Click to enlarge

The I.P. grid cut in 2005 and the results for detailed surveys are given in Figures 7, 8 (chargeability) and Figure 9 (resistivity) The coincident nature of the I.P. and MMI survey results are demonstrated for gold and silver overlain on chargeability I.P. data in Figures 10 and 11.

In 2006 O.T. Mining undertook detailed I.P. surveys over select high-priority I.P. anomalies defined in 2005 in preparation for drill testing. These high-priority targets comprise coincident MMI and I.P. responses. In addition, O.T. expanded the 2005 I.P. grid and continued the I.P. survey to fully delineate their large porphyry copper-molybdenum deposit in the North Anomaly area.


Click to enlarge

Fig 7
Click to enlarge


Click to enlarge

Fig 8
Click to enlarge


Click to enlarge

Fig 9
Click to enlarge


Click to enlarge

Fig 10
Click to enlarge


Click to enlarge

Fig 11
Click to enlarge


Detailed Geophysical Survey Results ( 2006 )
line

These figures illustrate the results of  “Quantitative Sections” produced from detailed 2006 geophysics. They show the shapes and depths of targets on Lines 42+00E to 49+00E, North Anomaly porphyry copper-molybdenum system.

These targets have the linear shape and Mobile Metal Ions soil geochemical signatures that could be representative of Main Stage veins. These veins were responsible for the bulk of base and precious metal ore mined at the Richest Hill On earth at Butte.

s
Click to enlarge
s

Fig 12
Click to enlarge

s
Click to enlarge
s

Fig 13
Click to enlarge

s
Click to enlarge
s

Fig 14
Click to enlarge

s
Click to enlarge
s

Fig 15
Click to enlarge

s
Click to enlarge
s

Fig 16
Click to enlarge

s
Click to enlarge
s

Fig 17
Click to enlarge

s
Click to enlarge
s

Fig 18
Click to enlarge

s
Click to enlarge
s

Fig 19
Click to enlarge


Mobile Metal Ions ( MMI ) Soil Geochemical Survey Results
line

A complete coverage map detailing all MMI survey areas for the whole property MMI PDF

On the maps and bar charts high metal contents and areas of importance are in RED and YELLOW colors, low values are in black and purple. FLESH tones signify very high metal contents.

Soil samples collected at 400’ intervals.

Numerous large targets defined.


Click to enlarge

Click to enlarge
North Anomaly Area


Click on the map thumbnails below to view a larger version or click the PDF icon to open a PDF map.

Click to enlarge
ZINC
line
Click to enlarge
COPPER
line
Click to enlarge
COBALT

PDF

PDF
PDF
line line line
Click to enlarge
ZINC, COPPER, COBALT COMBINED
Click to enlarge
CADMIUM
Click to enlarge
LEAD
PDF
PDF
PDF
line line line
Click to enlarge
NICKEL
Click to enlarge
PALLADIUM
Click to enlarge
GOLD
PDF
PDF
PDF
line line line
 
Click to enlarge
SILVER
 
PDF


2007 Drill Targets
line

An aggressive drill program has been designed to test geophysical (I.P.), geochemical (MMI) and geological targets. These targets have resulted from O.T.'s exploration on the North Anomaly undertaken between 2005 and 2007. The figure below shows the locations of the planned drill holes.

Click to enlarge
North-24k-2007 charge-DDH-16 May 2007
Click to enlarge

To further illustrate the targets a three-dimensional view of the North Anomaly targets is presented below. This 3-D model was developed by Watts, Griffis and McOuat based on geophysical (I.P.) data from surveys undertaken by Matrix Geotechnologies. The elongate, east-west linear features are interpreted as possible Main Stage veins. 

Click to enlarge
North Grid Anomaly 3D Concept
Click to enlarge

2008
line

PDF 2008 Summary of Porphyry Copper/Molybdenum Potential in the North Area - Revised June 2008


TOP

E-mail Updates