RUBY GOLD-SILVER MINE
-
High-grade precious metal mineralization (2.44 ounces per ton GOLD and 38.66 ounces per ton SILVER) with production of 47,000 ounces of gold and 680,000 ounces of silver
-
Additional zones of high grade base and precious metal mineralization (7.6% lead, 5.19% zinc, 1.31% copper, 4.3 opt silver and 0.002 opt gold) intersected during exploration to the northeast of the mine represent another attractive exploration target
-
Very high GOLD and SILVER soil geochemical assays defined in both of these areas and to the northwest of the mine in an area known as the “Ruby West” where no systematic exploration has been undertaken
-
Significant mineral potential for the discovery of “Ruby-type” epithermal gold-silver mineralization is indicated and demonstrated by the abundance of geophysical and geochemical anomalies that occur in the previously under-explored area surrounding the Ruby Mine
|
 |
|
Click to enlarge |
|
|
|
|
Click to enlarge |
|
|
|
|
Click to enlarge |
|
|
|
View from North Anomaly Ridge looking south toward Ruby Mine area. Arrow points to Ruby Mine. |
|
Compilation Ruby Mine |
|
Geophysical Grid |
2004 and 2005 Exploration Results

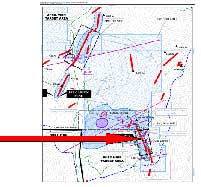
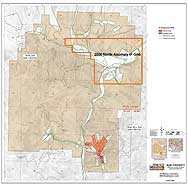
In 2005 O.T. Mining undertook a detailed review of all historic geological reports and supplemented these with the results of new geologic mapping by O.T. staff. This database supplemented an earlier (2004) Titan 24 “Deep-Looking” I.P. survey and formed the underpinnings for a detailed I.P. survey undertaken in 2005. In addition, Mobile Metal Ions surveys were initiated both east and northwest of the mine area. Figure 1 presents a compilation of exploration data from the Mine area as well as placing the Ruby Mine in context with the enlarged 2006 property boundary.
|
|
Click to enlarge
|
|
|
Titan 24 ( Quantec) Results
The Titan 24 I.P. survey was based on three transects (“r1, r2 and r3”) in the Ruby Mine area and these are depicted in Figure 2. Two drill targets are apparent in the area and these are interpreted to be zones of sulphide mineralization in association with strong alteration. Earlier geophysical surveys have indicated there exists potential for deep “porphyry-style” mineralization underlying the Ruby Mine area.
|
|
Fig.2
Click to enlarge
|
|
|
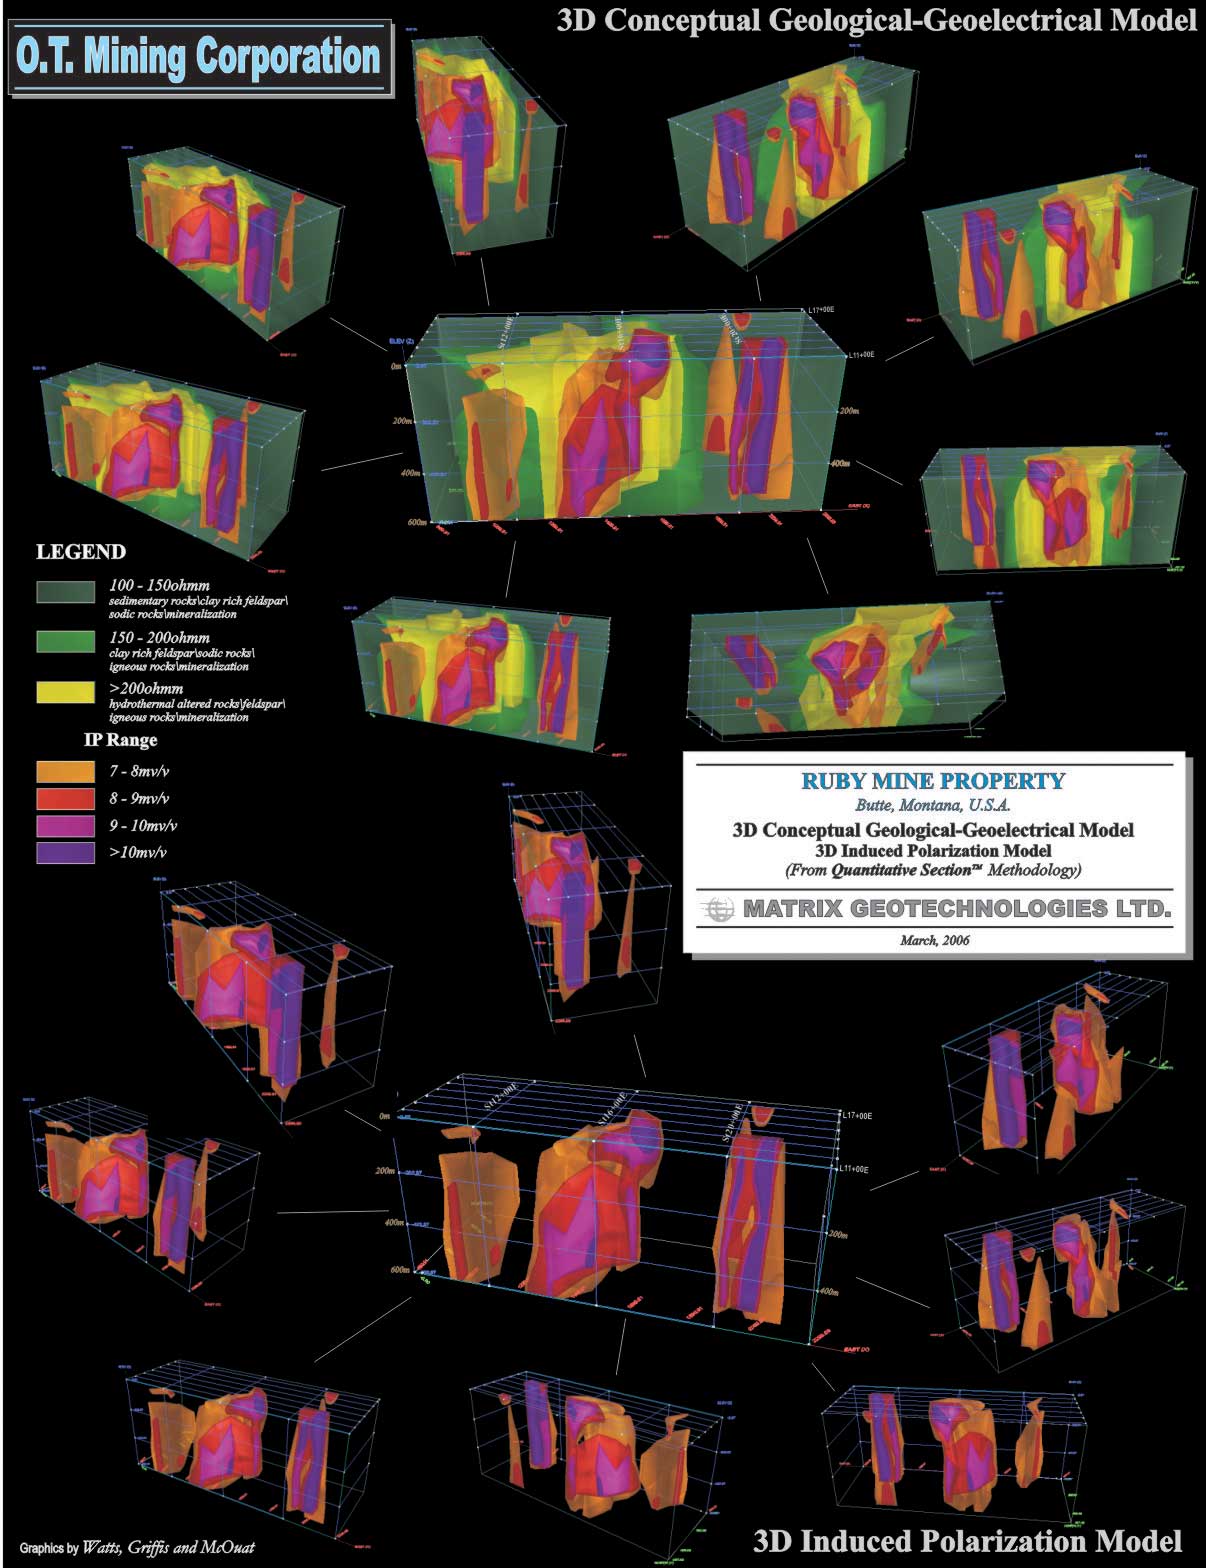
Detailed I.P. Surveys ( Matrix Geotechnologies)
A large program of detailed I.P. was undertaken in the Ruby Mine area and the area to the north and northwest. Numerous long and short strike length chargeability anomalies were documented. The I.P. results from the Ruby Mine are presented in a three-dimensional model to better visualize the gold and silver-bearing mineralized zones that responded to the I.P. survey. This view is presented in Figure 3. The proliferation of I.P. anomalies in the Ruby Mine area and surrounding environs are depicted in Figures 4 and 5. A total of 69 line kilometers were established in the area for the survey. The grid is depicted in Figure 6. These geophysical responses will be combined with new MMI data to identify drill targets. |
|
Fig.3
Click to enlarge
|
|
|
|
|
Fig.4
Click to enlarge
|
|
|
|
|
Fig.5
Click to enlarge
|
|
|
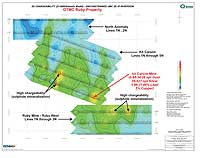
New Base and Precious Metal Discovery
In 2005 a coincident I.P. and a base and precious metal MMI anomaly was drill tested. The drill hole (05C-3) intersected a 4.4-foot sulphide vein comprising galena, sphalerite and chalcopyrite. Assay results returned 2% copper and greater than 10% combined zinc and lead and up to 75 grams per ton silver. Geological mapping and prospecting identified the weathered surface expression of this vein and assay results gave 2-5% lead and 21 ounces per ton silver.
This zone is interpreted to be a new discovery that is situated in the immediate Ruby Mine geological environment. It underscores the potential for previously unrecognized mineralization and represents a follow-up target for O.T. Mining.
Mobile Metal Ions and Geophysical Results for Gold ("AuRR') and Silver ("AgRR") in the Ruby Mine Area
Overlaying the results for gold and silver on geophysical survey results (induced polarization or I.P. chargeability) indicates the presence of significant gold and silver anomalies and the potential for additional precious metal mineralization in the Ruby Mine area.
|
|
|
GOLD
Click to enlarge
|
|
|
|
|
SILVER
Click to enlarge
|
|
|
Mobile Metal Ions ( MMI ) Soil Geochemical Survey Results
A complete coverage map detailing all MMI survey areas for the whole property MMI 
On the maps and bar charts high metal contents and areas of importance are in RED and YELLOW colors, low values are in black and purple. FLESH tones signify very high metal contents.
Soil samples collected at 50’ intervals.
|
|
Click to enlarge
Ruby Mine Area |
|
|
Click on the map thumbnails below to view a larger version or click the PDF icon to open a PDF map.
TOP
|