KIT CARSON
- Target area 5,000’ by 2,000’
- High-grade gold and silver veins are indicated by high gold and silver assays from surface rock samples
- High soil geochemical assays for gold, silver, copper, lead, zinc and nickel define a target 2,500’ long by 750’ wide
- Target is approximately 1000’ below the surface (geophysical interpretation)
- Kit Carson target area named after adjacent, past-producing Kit-Carson gold-silver mine that had exceptional grades of 0.88 to 34.28 ounces per ton gold, 35 to 527 ounces per ton silver, 1.96 to 11.84% lead and up to 5% copper
|
|
 |
|
Click to enlarge |
|
|
|
|
Click to enlarge |
|
|
|
View looking west up Kit Carson Gulch
from the West Ruby area |
|
Compilation Kit Carson |
Exploration Results 
Subsequent to the delineation of a series of magnetic lows and highs (Fugro, 2001) associated with the Kit Carson survey area and the definition of large gold and silver MMI soil geochemical anomalies in the same area O.T. Mining has moved ahead with focused deep-looking geophysical surveys in this area. In 2004 a Titan 24 survey was undertaken in the Kit Carson area and resulted in the delineation of northeast-trending linear zones of alteration and mineralization-related responses.
These responses are depicted in the Titan 24 survey figure below and make an interesting comparison between the results on the Kit Carson survey area and the adjacent Kit Carson Mine. The deep-penetrating nature of these surveys also documented the presence of the Boulder Batholith at depth in the northern part of the Kit Carson area. This was possible owing to the ability of Titan 24 to see to depths of 1000 m.
Currently, O.T. Mining is undertaking detailed ground I.P. surveys to define and more sharply focus drill targets at Kit Carson. To date, all available data has been integrated to assess the area for an overall exploration strategy.
The results of this integration are presented below under “Integrated Geophysics and Mobile Metal Ion Soil Geochemical Survey Results”. These plots indicate the significant gold and silver MMI anomaly occurs at the western edge of a magnetic high and coincident with a moderate chargeability response. This anomaly will be drill-tested by O.T. Mining in 2007 as well as additional anomalies defined by the current I.P. program. |
|
Click to enlarge |
|
|
|
Click to enlarge |
|
|
|
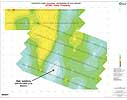
Airborne Magnetics
 Source of metals for Kit Carson target area
 |
|
Blue indicates the presence of a LARGE mineralizating system |
|
|
Mobile Metal Ions ( MMI ) Soil Geochemical Survey Results
A complete coverage map detailing all MMI survey areas for the whole property MMI 
On the maps and bar charts high metal contents and areas of importance are in RED and YELLOW colors, low values are in black and purple. FLESH tones signify very high metal contents.
Soil samples initially collected at 500’ intervals and subsequently 100’ intervals to accurately define the anomaly.
Soil anomaly is 2,500’ long and up to 750’ wide. Soil anomaly is open to the southwest and northeast. |
|
Click to enlarge
Kit Carson Area
|
|
|
Click on the map thumbnails below to view a larger version or click the PDF icon to open a PDF map.
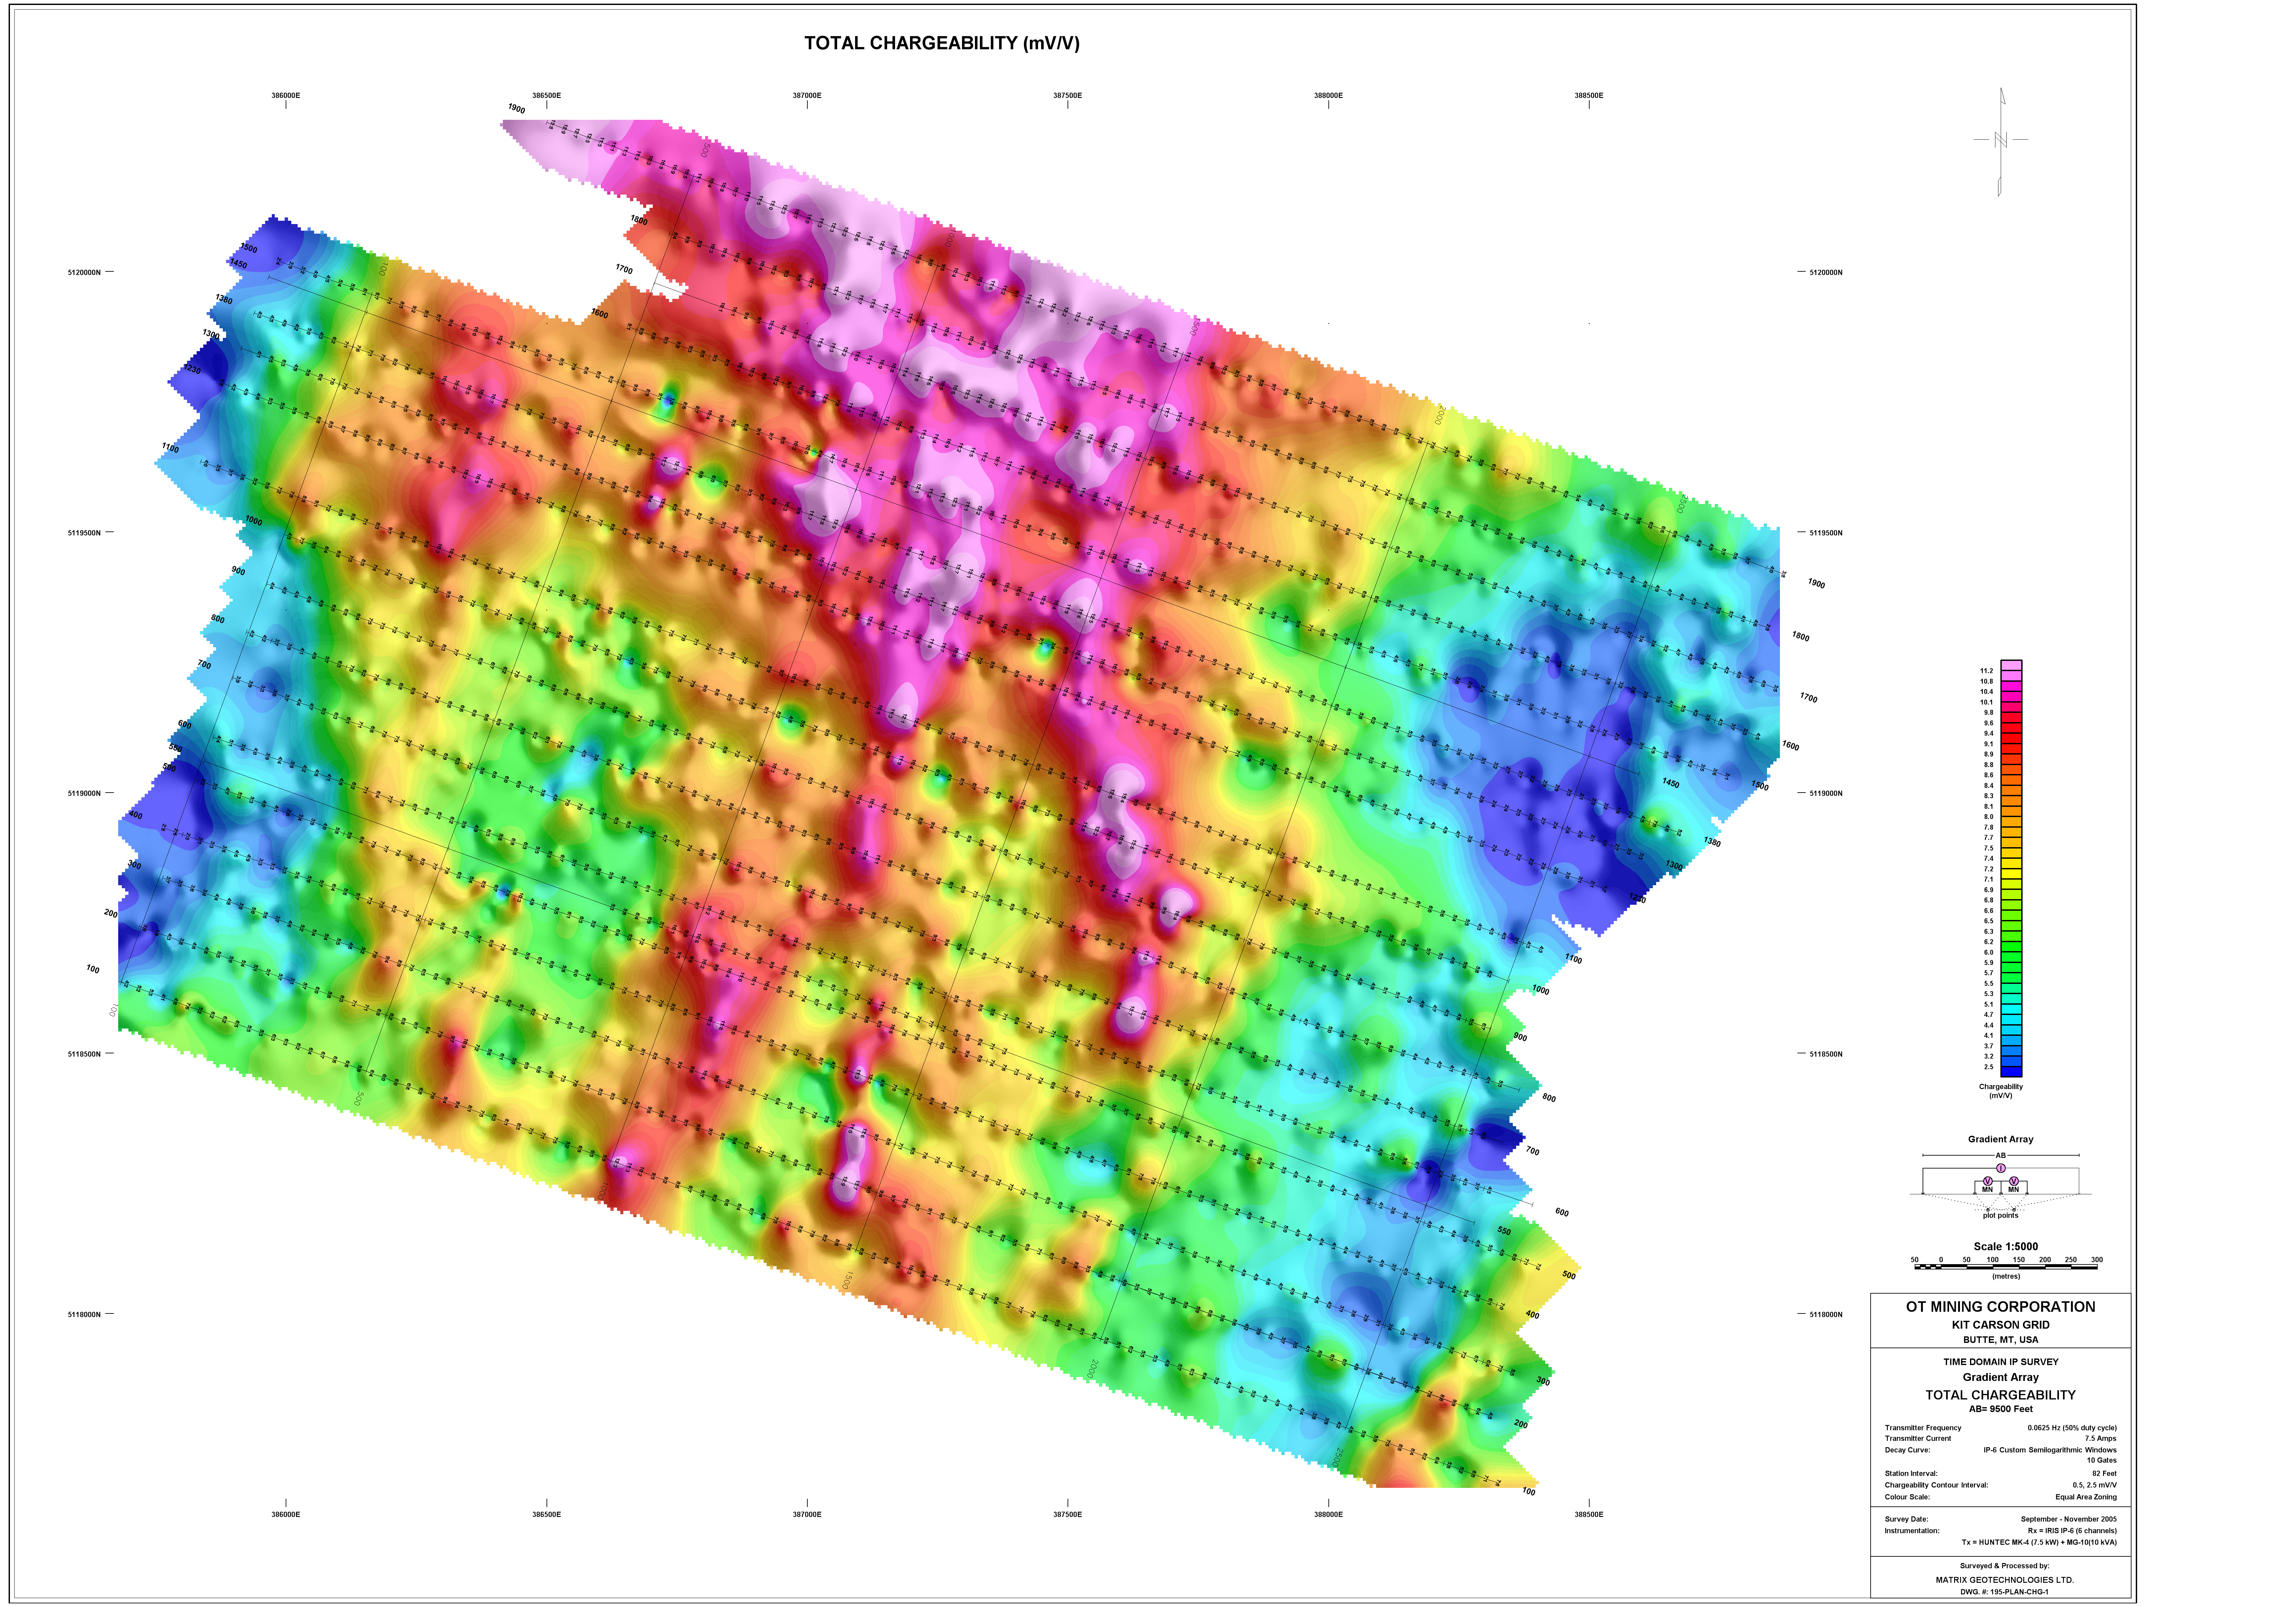
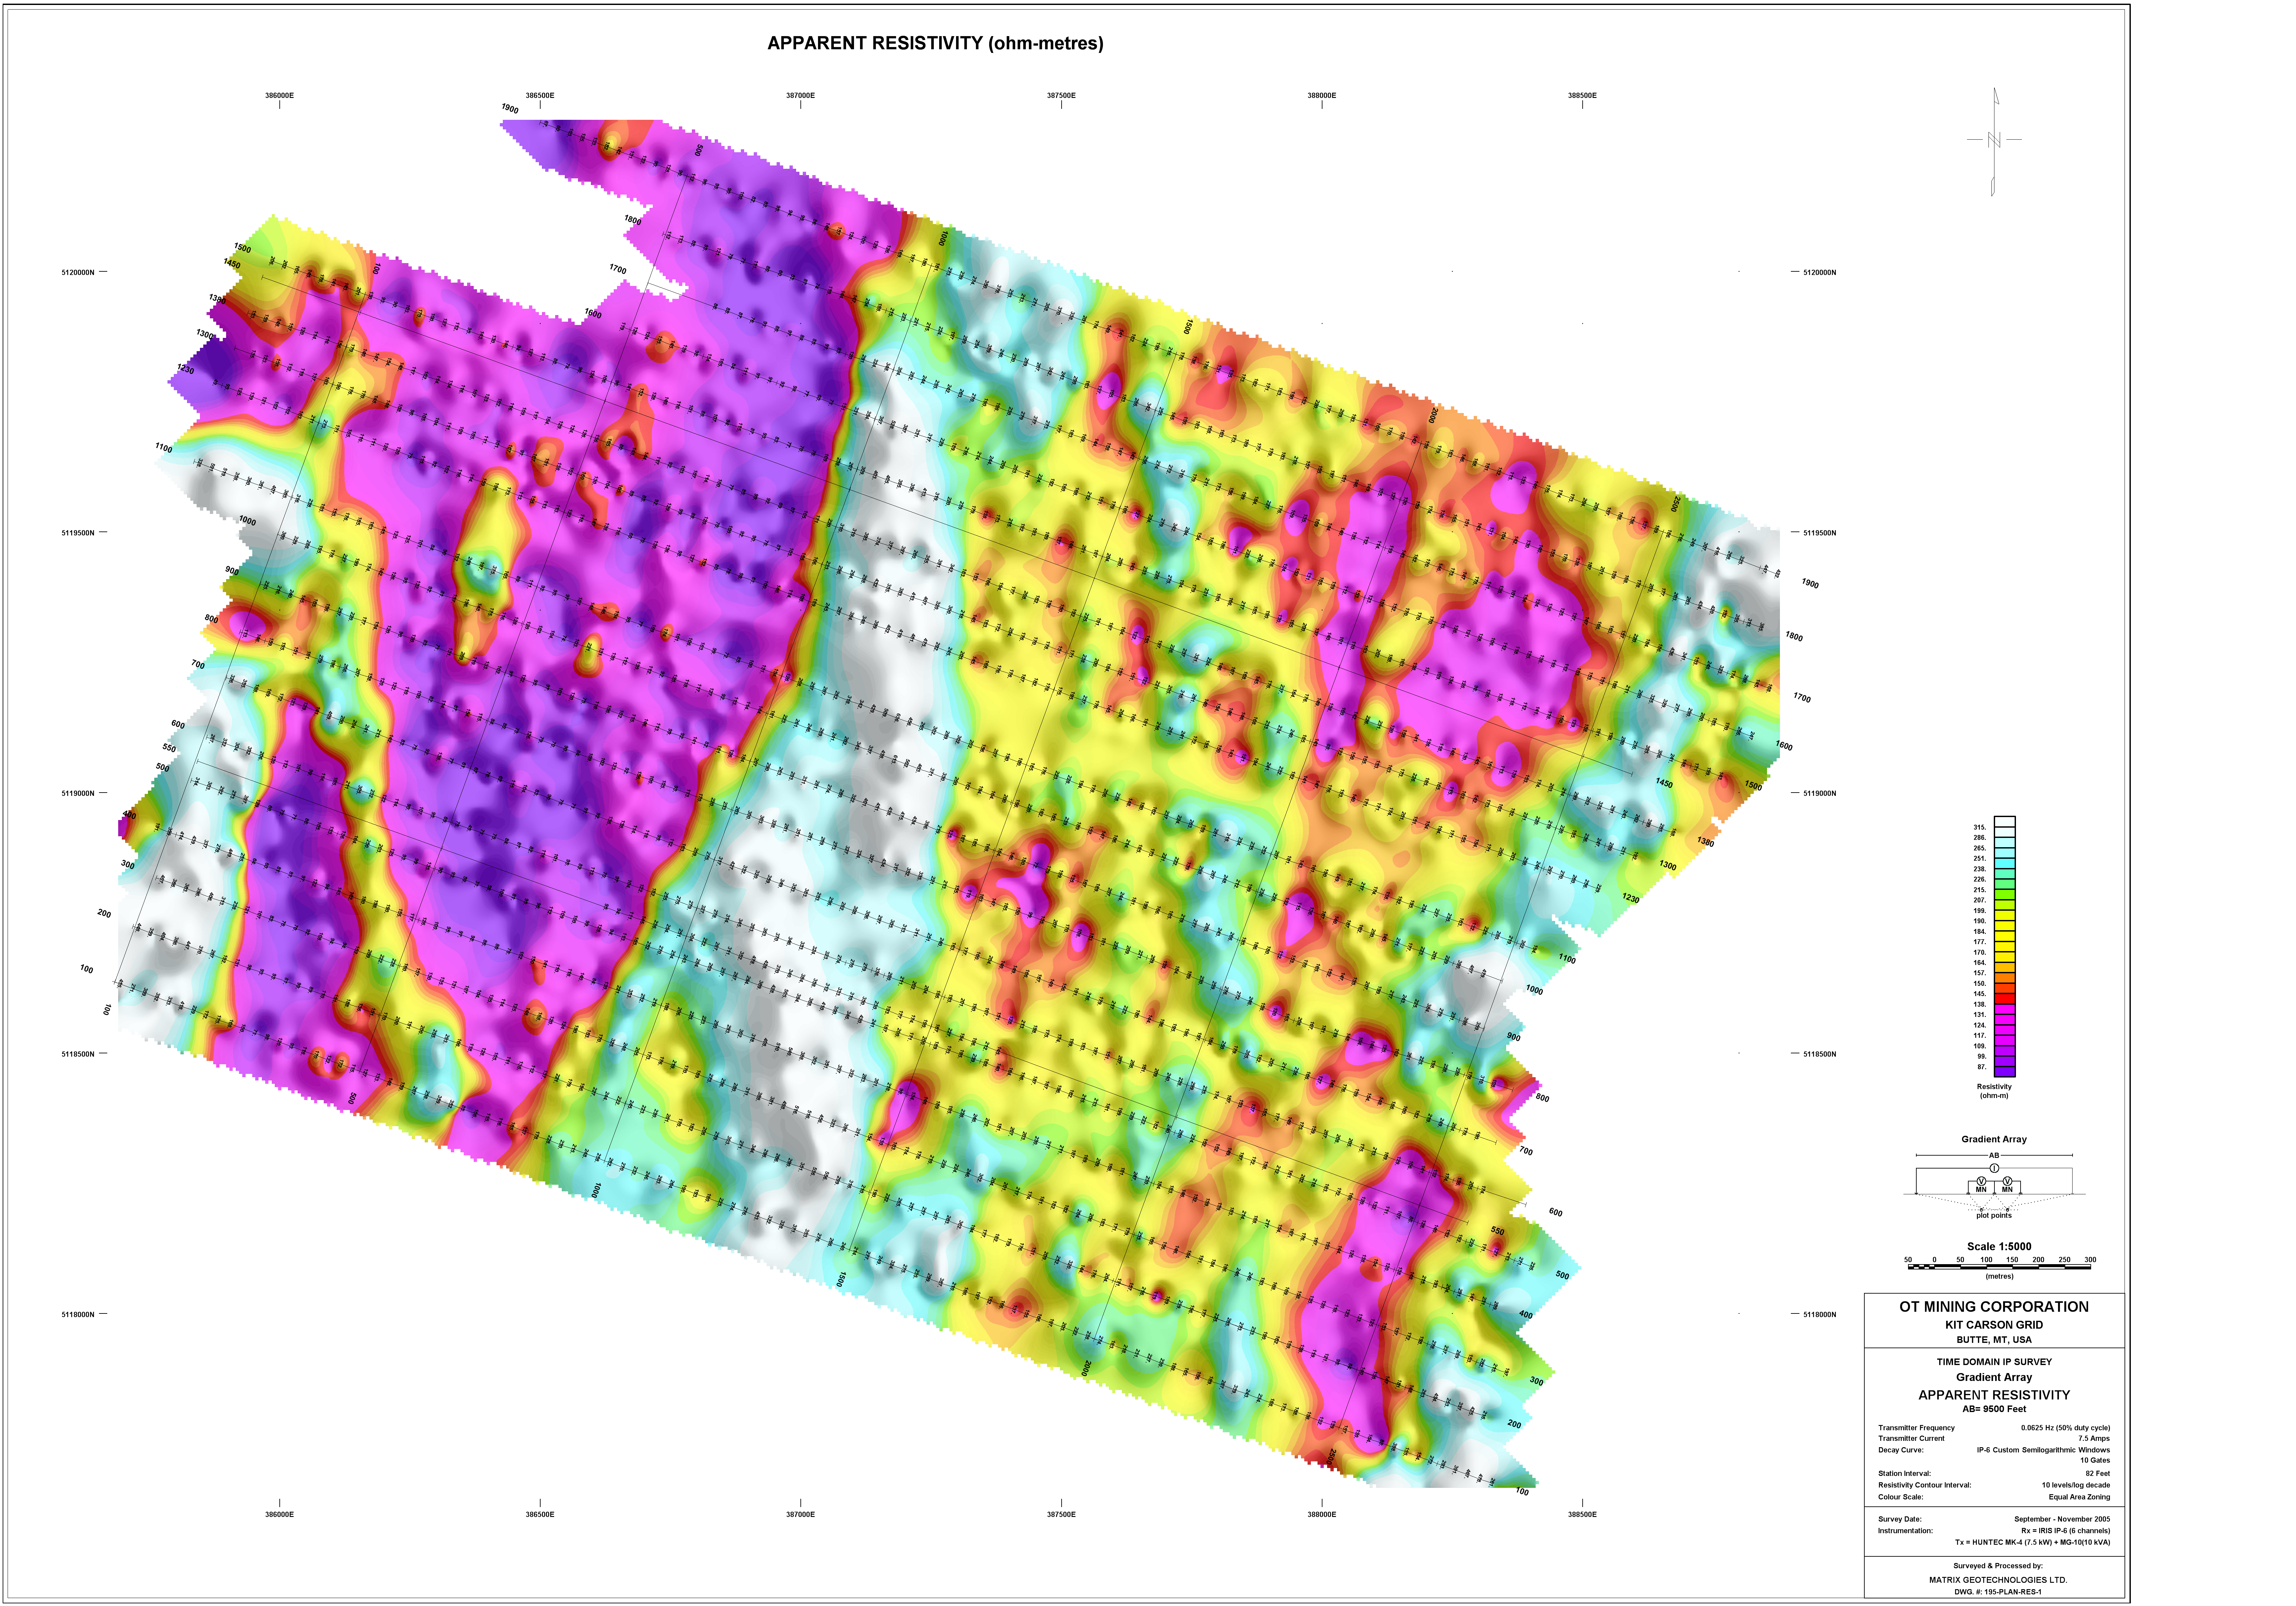
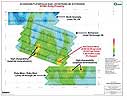
2007 Geophysical Survey Results
New detailed geophysical surveys in 2006 resulted in the discovery of significant chargeability and resistivity anomalies indicative of base and precious metal mineralization. These anomalies are associated with north-northwest-trending linear anomalies that O.T. interprets as faults. These anomalies will be drill-tested in 2007.
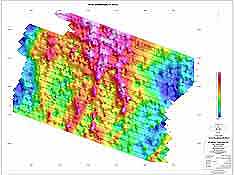 Chargeability map
|
|
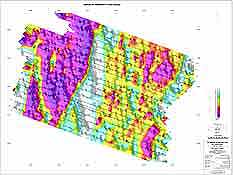 Resistivity map
|
Click image for high resolution version ( 9.03 Mb ) |
Click image for high resolution version ( 9.43 Mb ) |
|
NOTE: The high resolution version of the above images are large files. You can Right-Click on the thumbnails to save them on your computer,or allow enough time for download. |
Integrated Geophysics and Mobile Metal Ion Soil Geochemical Survey Results
Click the PDF icon to open a PDF map
Kit Carson Target
- Extensive target area ( 5,000’ by 2,000’ )
- Abundant high GOLD and SILVER assays
- 2,500’ by 700’ soil geochemical target for GOLD, SILVER, COPPER, LEAD, ZINC, CADMIUM, NICKEL and PALLADIUM
- Buried magnetic source of metals identified 1000’ below surface
- Potential for large scale, high grade GOLD, SILVER and BASE METALS
- Beside high grade Kit Carson Mine
- Occurs beside the Kit Carson Target Area, but is NOT on O.T. ground
- Mine was a high grade gold-silver-copper-lead mine from the 1860’s
- Exceptional grades of 0.88 to 34.28 ounces per ton gold, 35 to 527 ounces per ton silver, 1.96 to 11.84% lead and up to 5% copper
- Geological setting is similar to the Kit Carson Target Area
TOP
|